|
|||||||||||||||||||||||
| Home | Site Map | About | News | Purchase | Products | Download | Support | Search | |||||||||||||||
|
|
|||||||||||||||||||||||
|
|||||||||||||||||||||||
| Home | Site Map | About | News | Purchase | Products | Download | Support | Search | |||||||||||||||
|
|
|||||||||||||||||||||||
|
New Data Layers Capabilities Three new features have been added to Data type layers:
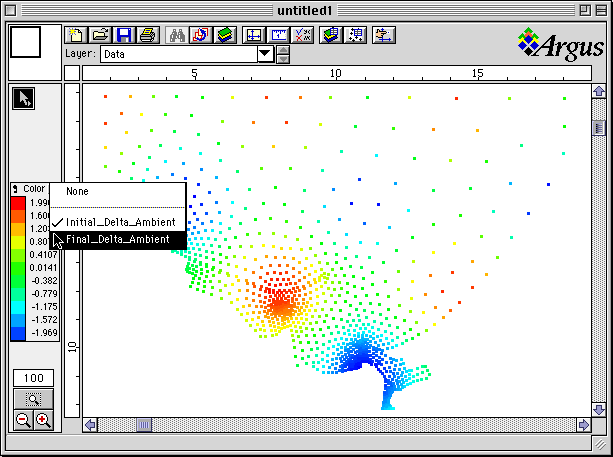
Evaluation of Data Layer Parameters using Colors As in Information, Grid, and Mesh type layers you can now visualize the values of data layer parameters using the Evaluate by Color method. This allows you to quickly view the distribution of data. To evaluate data by color
For a detailed discussion of how to control the color range see Chapter 1, "The color tools and legend".
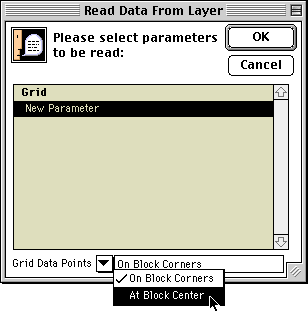
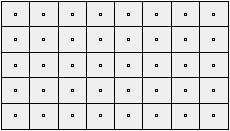
Reading Data From Grids at Block Centers When using block centered grids the evaluation of block and grid parameters is performed at block centers. To conform with this evaluation locations, you can also read data from grids at block centers. This will also allow you to compare simulation results with inputted grids using the same locations for both. By default the data is read at block corners.
To the next page |
||||||||||||||||||||||||