 |
|||||||||||||||||||||||
| Home | Site Map | About | News | Purchase | Products | Download | Support | Search | |||||||||||||||
|
|
|||||||||||||||||||||||
 |
|||||||||||||||||||||||
| Home | Site Map | About | News | Purchase | Products | Download | Support | Search | |||||||||||||||
|
|
|||||||||||||||||||||||
Visualize Model Input and Output
Visualization tools also allow you to visually investigate the data you prepare using the pre-processing tools of the application. Thus, for example, you can create a 3D surface describing the nodal values of a geological formation roof, of the bathymetry of a lake, or perform a full site characterization.
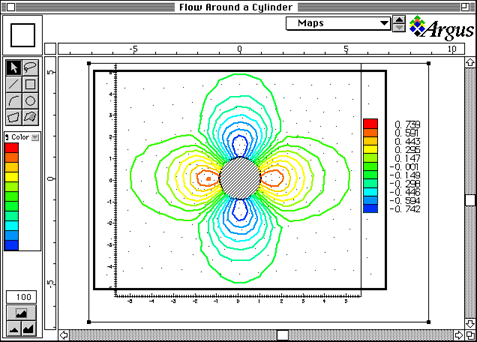
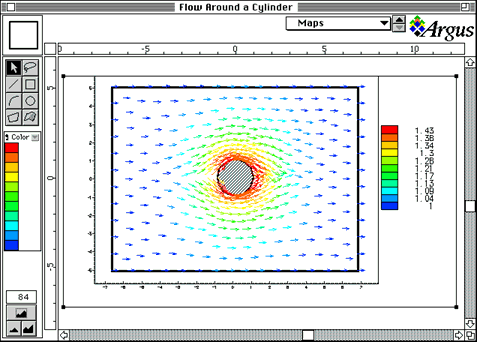
Six scientific visualization methods are available: 3D Surface, Color Map, Contour Map, Vector Diagram, Particle path-lines and Cross sections. Creating a visualization object is as simple as stretching a rectangle to specify where you want the object to be located and selecting the parameters to be presented. Full control over visualization parameters such as color, shading and camera location is available.

The 3D Surface tool enables you to visualize the spatial distribution of a parameter.

The Color Map tool enables you to visualize the intensity distribution of a parameter.

The Contour Map tool enables you to contour a parameter's distribution.

The Vectors Diagram tool enables you to plot vector fields. You can control arrow length, width and color.

The Particle path-lines tool enables you to present particle tracking. Both for-tracking and back-tracking are available.

The Cross-Section tools enables you to visualize a parameter's distribution along a cross-section line. Any number of parameters can be visualized at the same cross-section. The cross section line can be easily created on-screen.

Being based on CAD-like layers, Argus Open Numerical Environments allow you to organize your scientific visualization objects in any form and size within a layer and also in different layers. Visualization objects can be resized, moved and deleted. This allows you to fully control your view and at the same time enables you to easily prepare well presented reports.
To find out more about Argus and its products email marketing@argusone.com or call:
+972-9-957-5752
Tech. support: support@argusone.com
snail mail: Argus Holdings, POB 6254, Herzelia, 46160, Israel
Copyright © Argus Holdings, Ltd. 1992-2015